
ArtLover
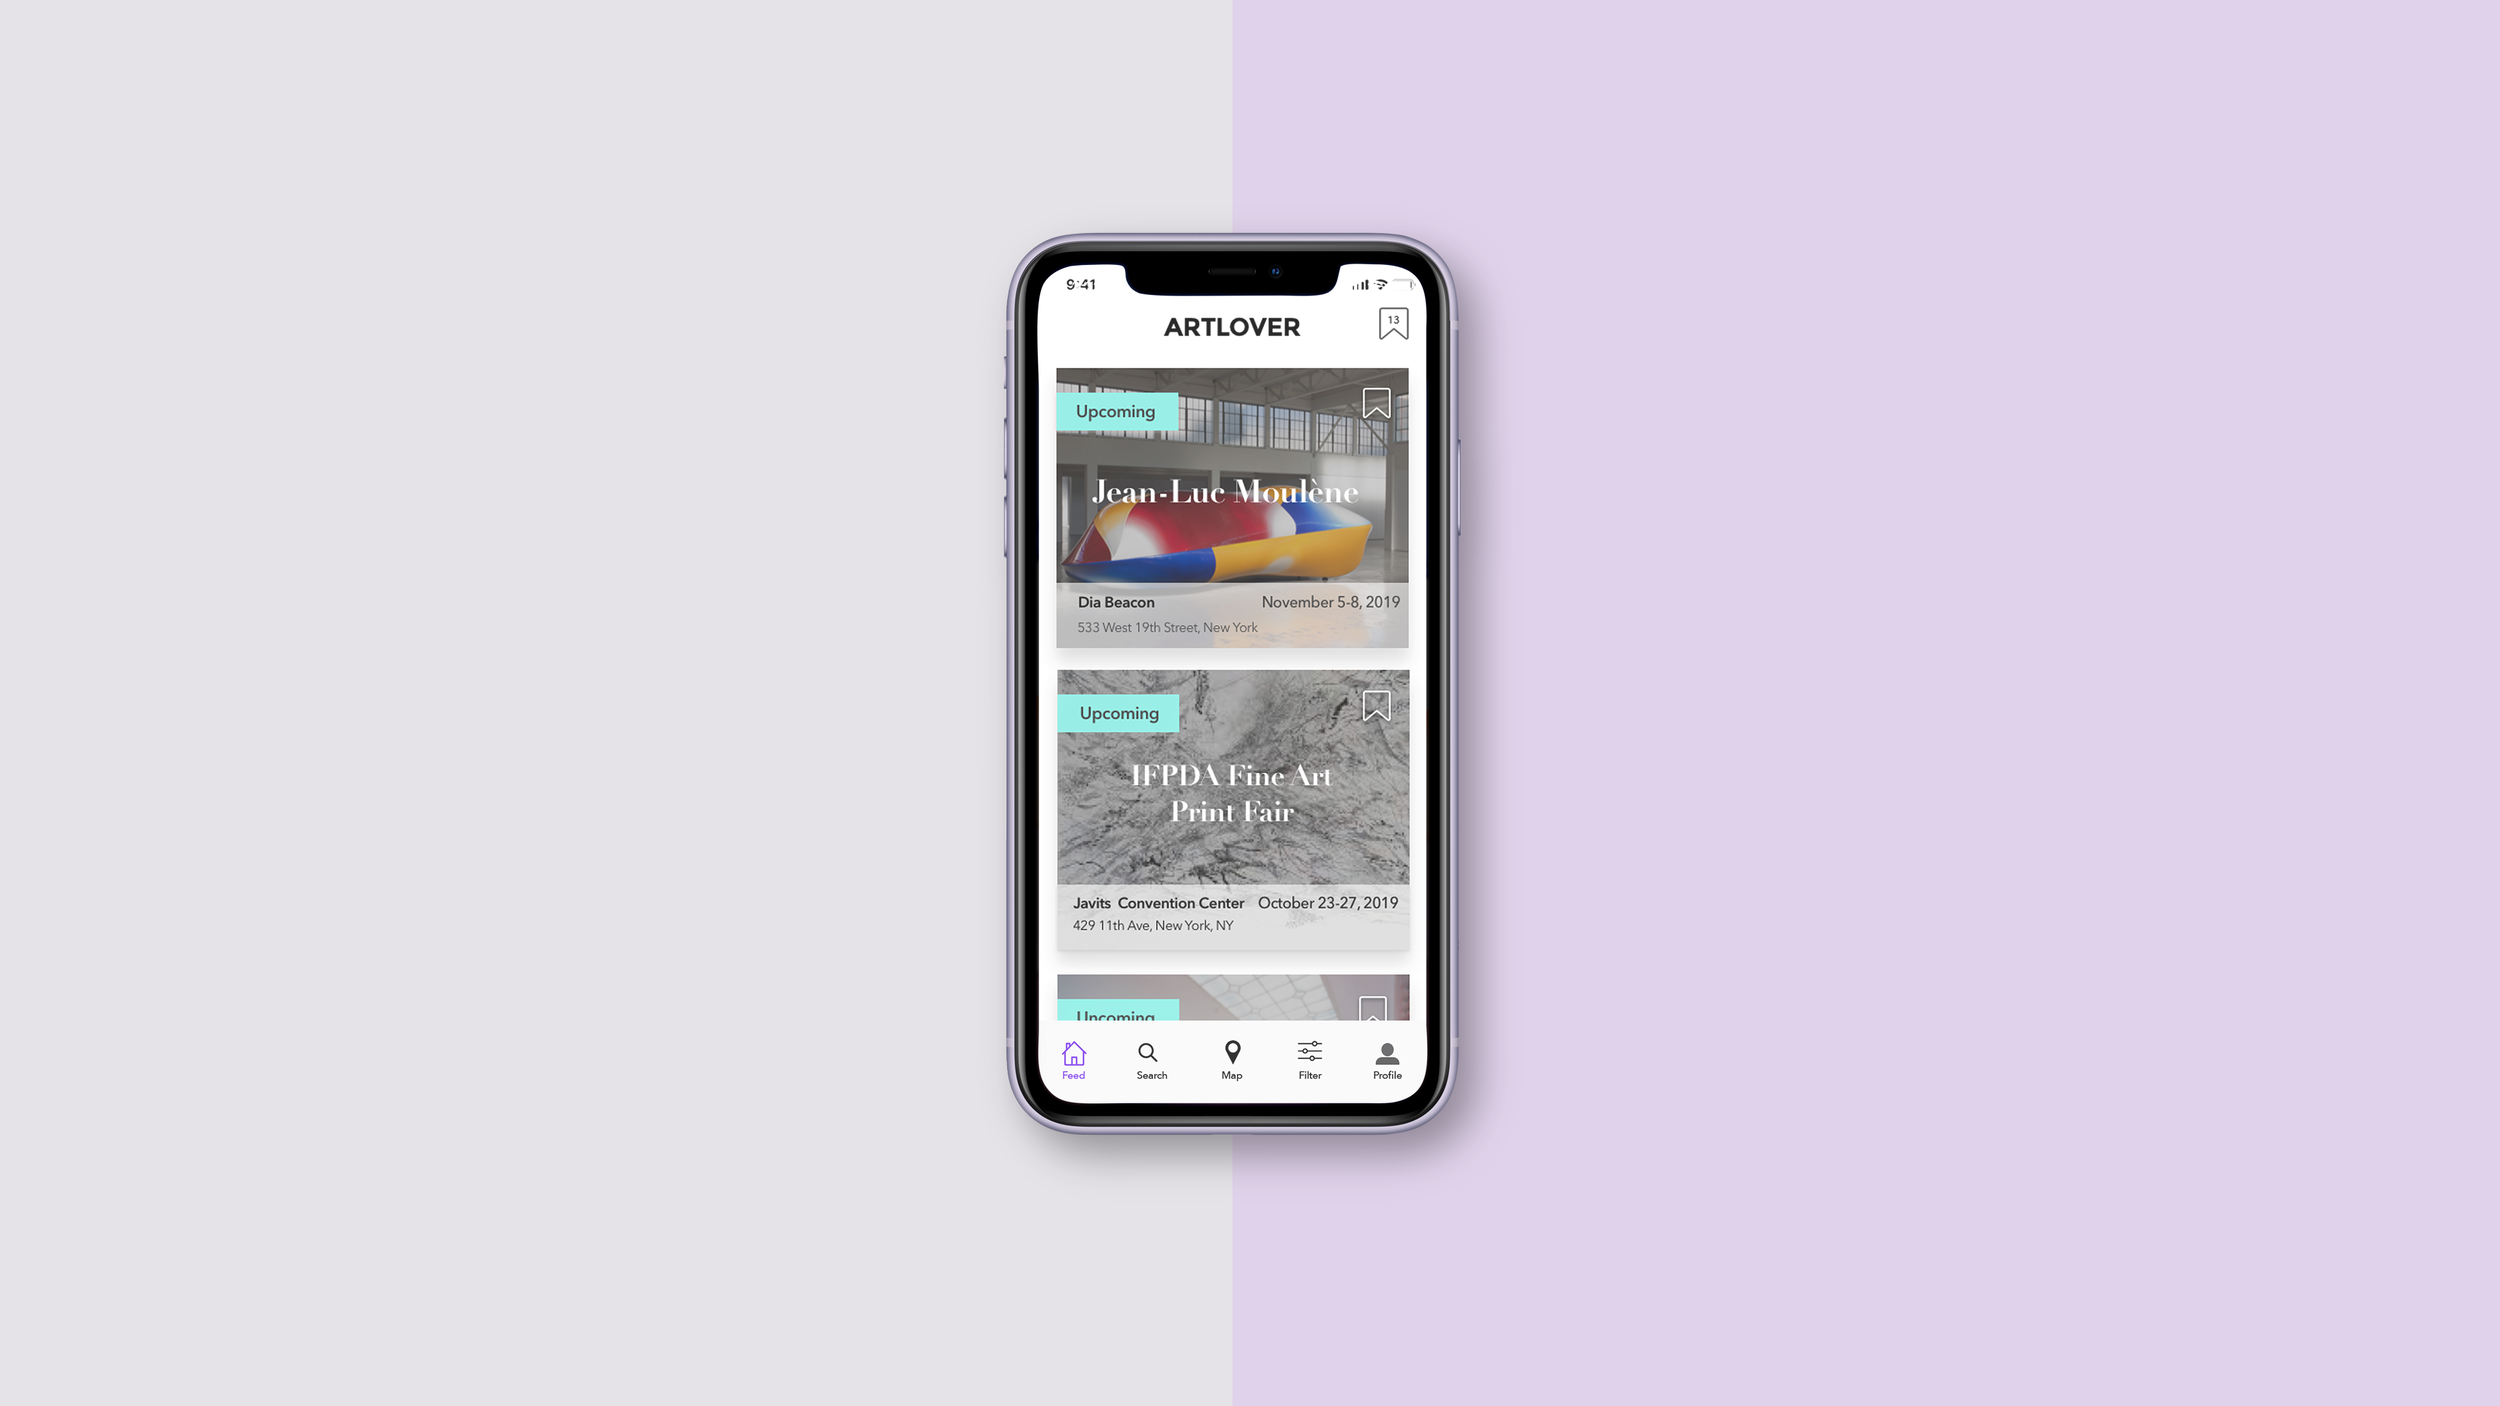
ARTLOVER is an app to find Art exhibits
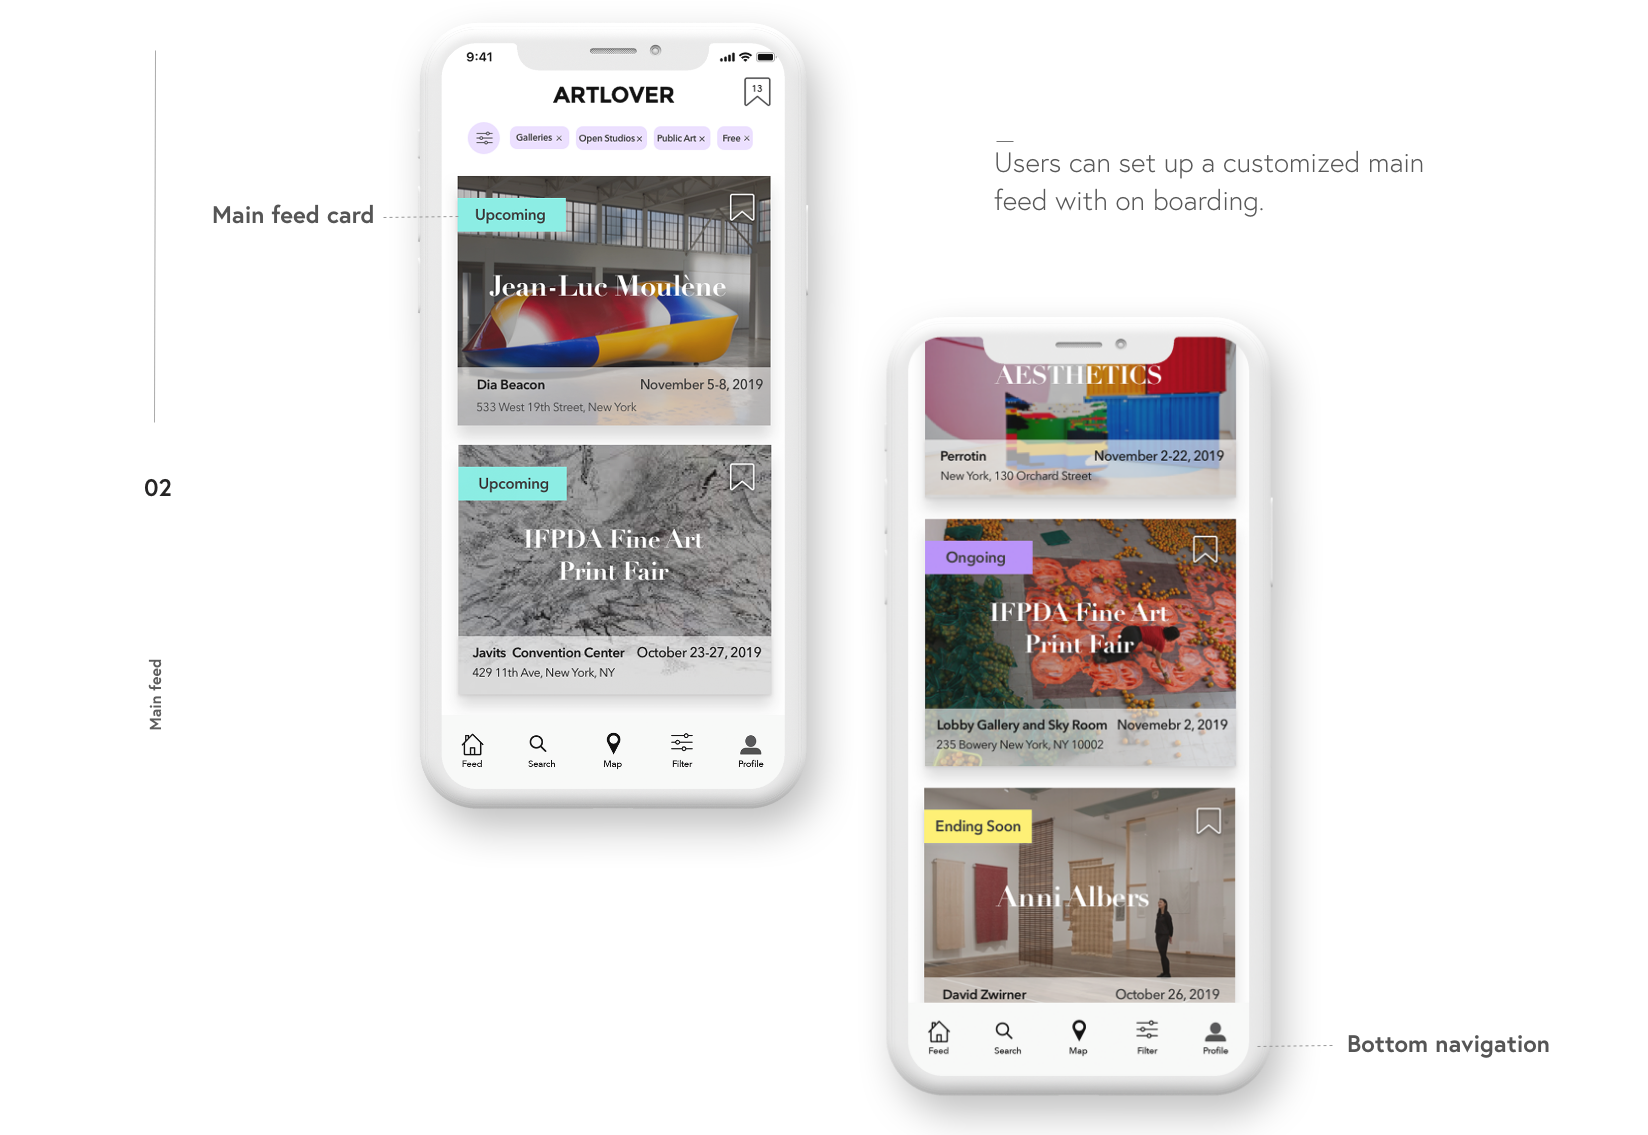
The goal of this project is to provide up-to-date information that is both valuable and easy to access from anywhere at any time.
-
The UX team : Gina(Jinhwa) Kim, Quinn Tully-Doyle, David Betz
My Role: UX & UI Designer
-
User Research&Interview / User Journey/ Personas / Feature Prioritization / Wireframes / Prototyping / Usability Testing / High Fidelity Mockups
-
01_Overview
What is the problem area?
People living in New York are overwhelmed by the localized nature of information about the goings-on of the art world. The inability to discover new artists and attend art exhibits can often lead to people becoming frustrated, missing events they want to attend, and feeling out of touch.
The world of art is ever changing, especially in New York. As a UX team, we wanted to help people who struggle to find art scene in this various choices. We set out to improve the experience of visiting art galleries/viewing art for residents and non-residents of New York.
02_Process
How did we do it?
-
![]()
Research
After screening possible interviewees, our team conducted a User Interview.
-
![]()
Synthesis
Our team implemented Affinity Mapping, Persona, and User Flow.
-
![]()
Ideate
Our team conducted Design Studio for co-creating designs effectively. Then, we designed Lo-Fi and Hi-Fie mockups and iterated them.
-
![]()
Deliver
We presented the outcome to our client and delivered the designs and all deliverables.


03_Research
Where to begin research?
We began by screening possible interviewees to ensure we were speaking with our user base.
After screening survey, we received responses from 35 people, specifically, that 84.8% of people get information from a friend’s suggestion. 69.7% of people usually get information from social media. Based on screening survey, we chose six people who at least had attended art exhibits in the last 3 months, both male and female. We sat down with six people and asked them questions focused on three things:
Experience when visiting exhibits
Behaviors when looking for art exhibits
Resources used to discover events
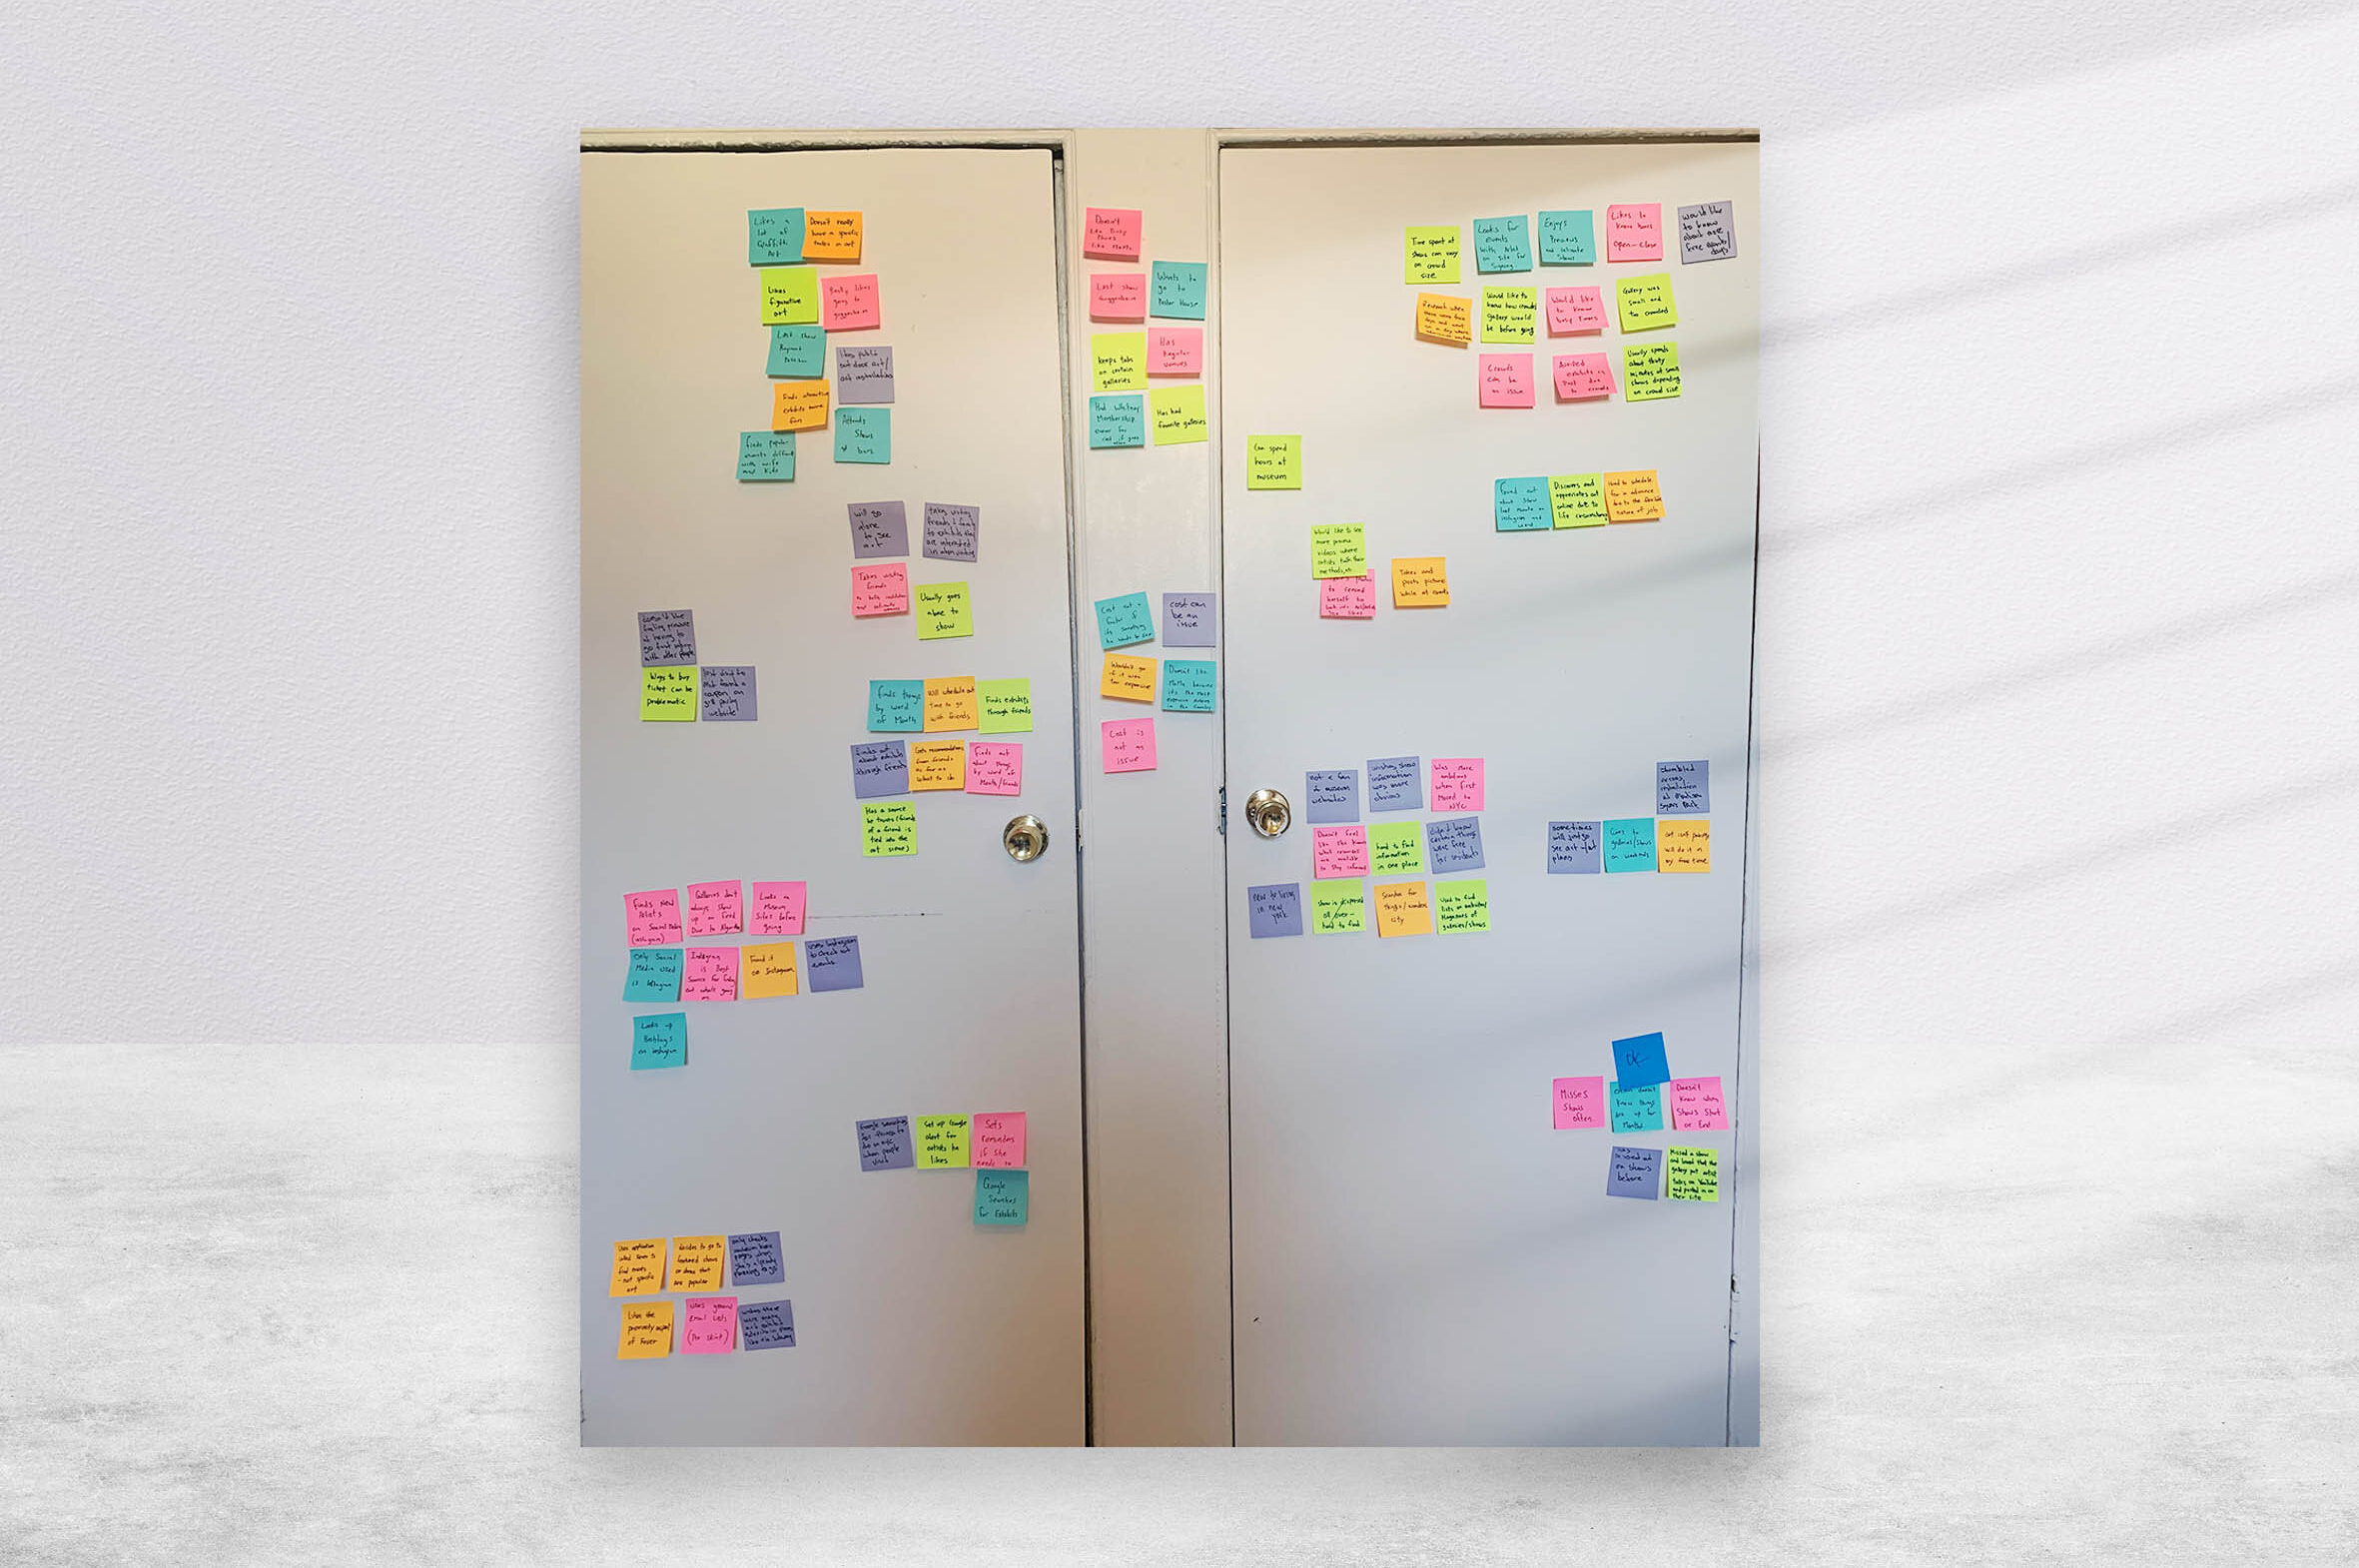
After conducting user interviews, we used a tool called “Affinity Mapping”. This tool helps us organize from large amounts of data from users into groupings based on the relevant relationships.
04_Synthesis
Key insights from affinity mapping
Users feel overwhelmed by the amount of art events going on in the city.
“There’s always something interesting going on here. It can be too much to keep up sometimes.”
Users wanted to know more detailed information like exhibit size, free days, crowded times, and special events.
“I love to go to things like a pre-opening where you can spend more time looking than rushing through.”
Users felt like they were missing out because they didn’t have an easy way to find information.
“Information about galleries and shows is dispersed all over - there’s nowhere to get information in one place.”
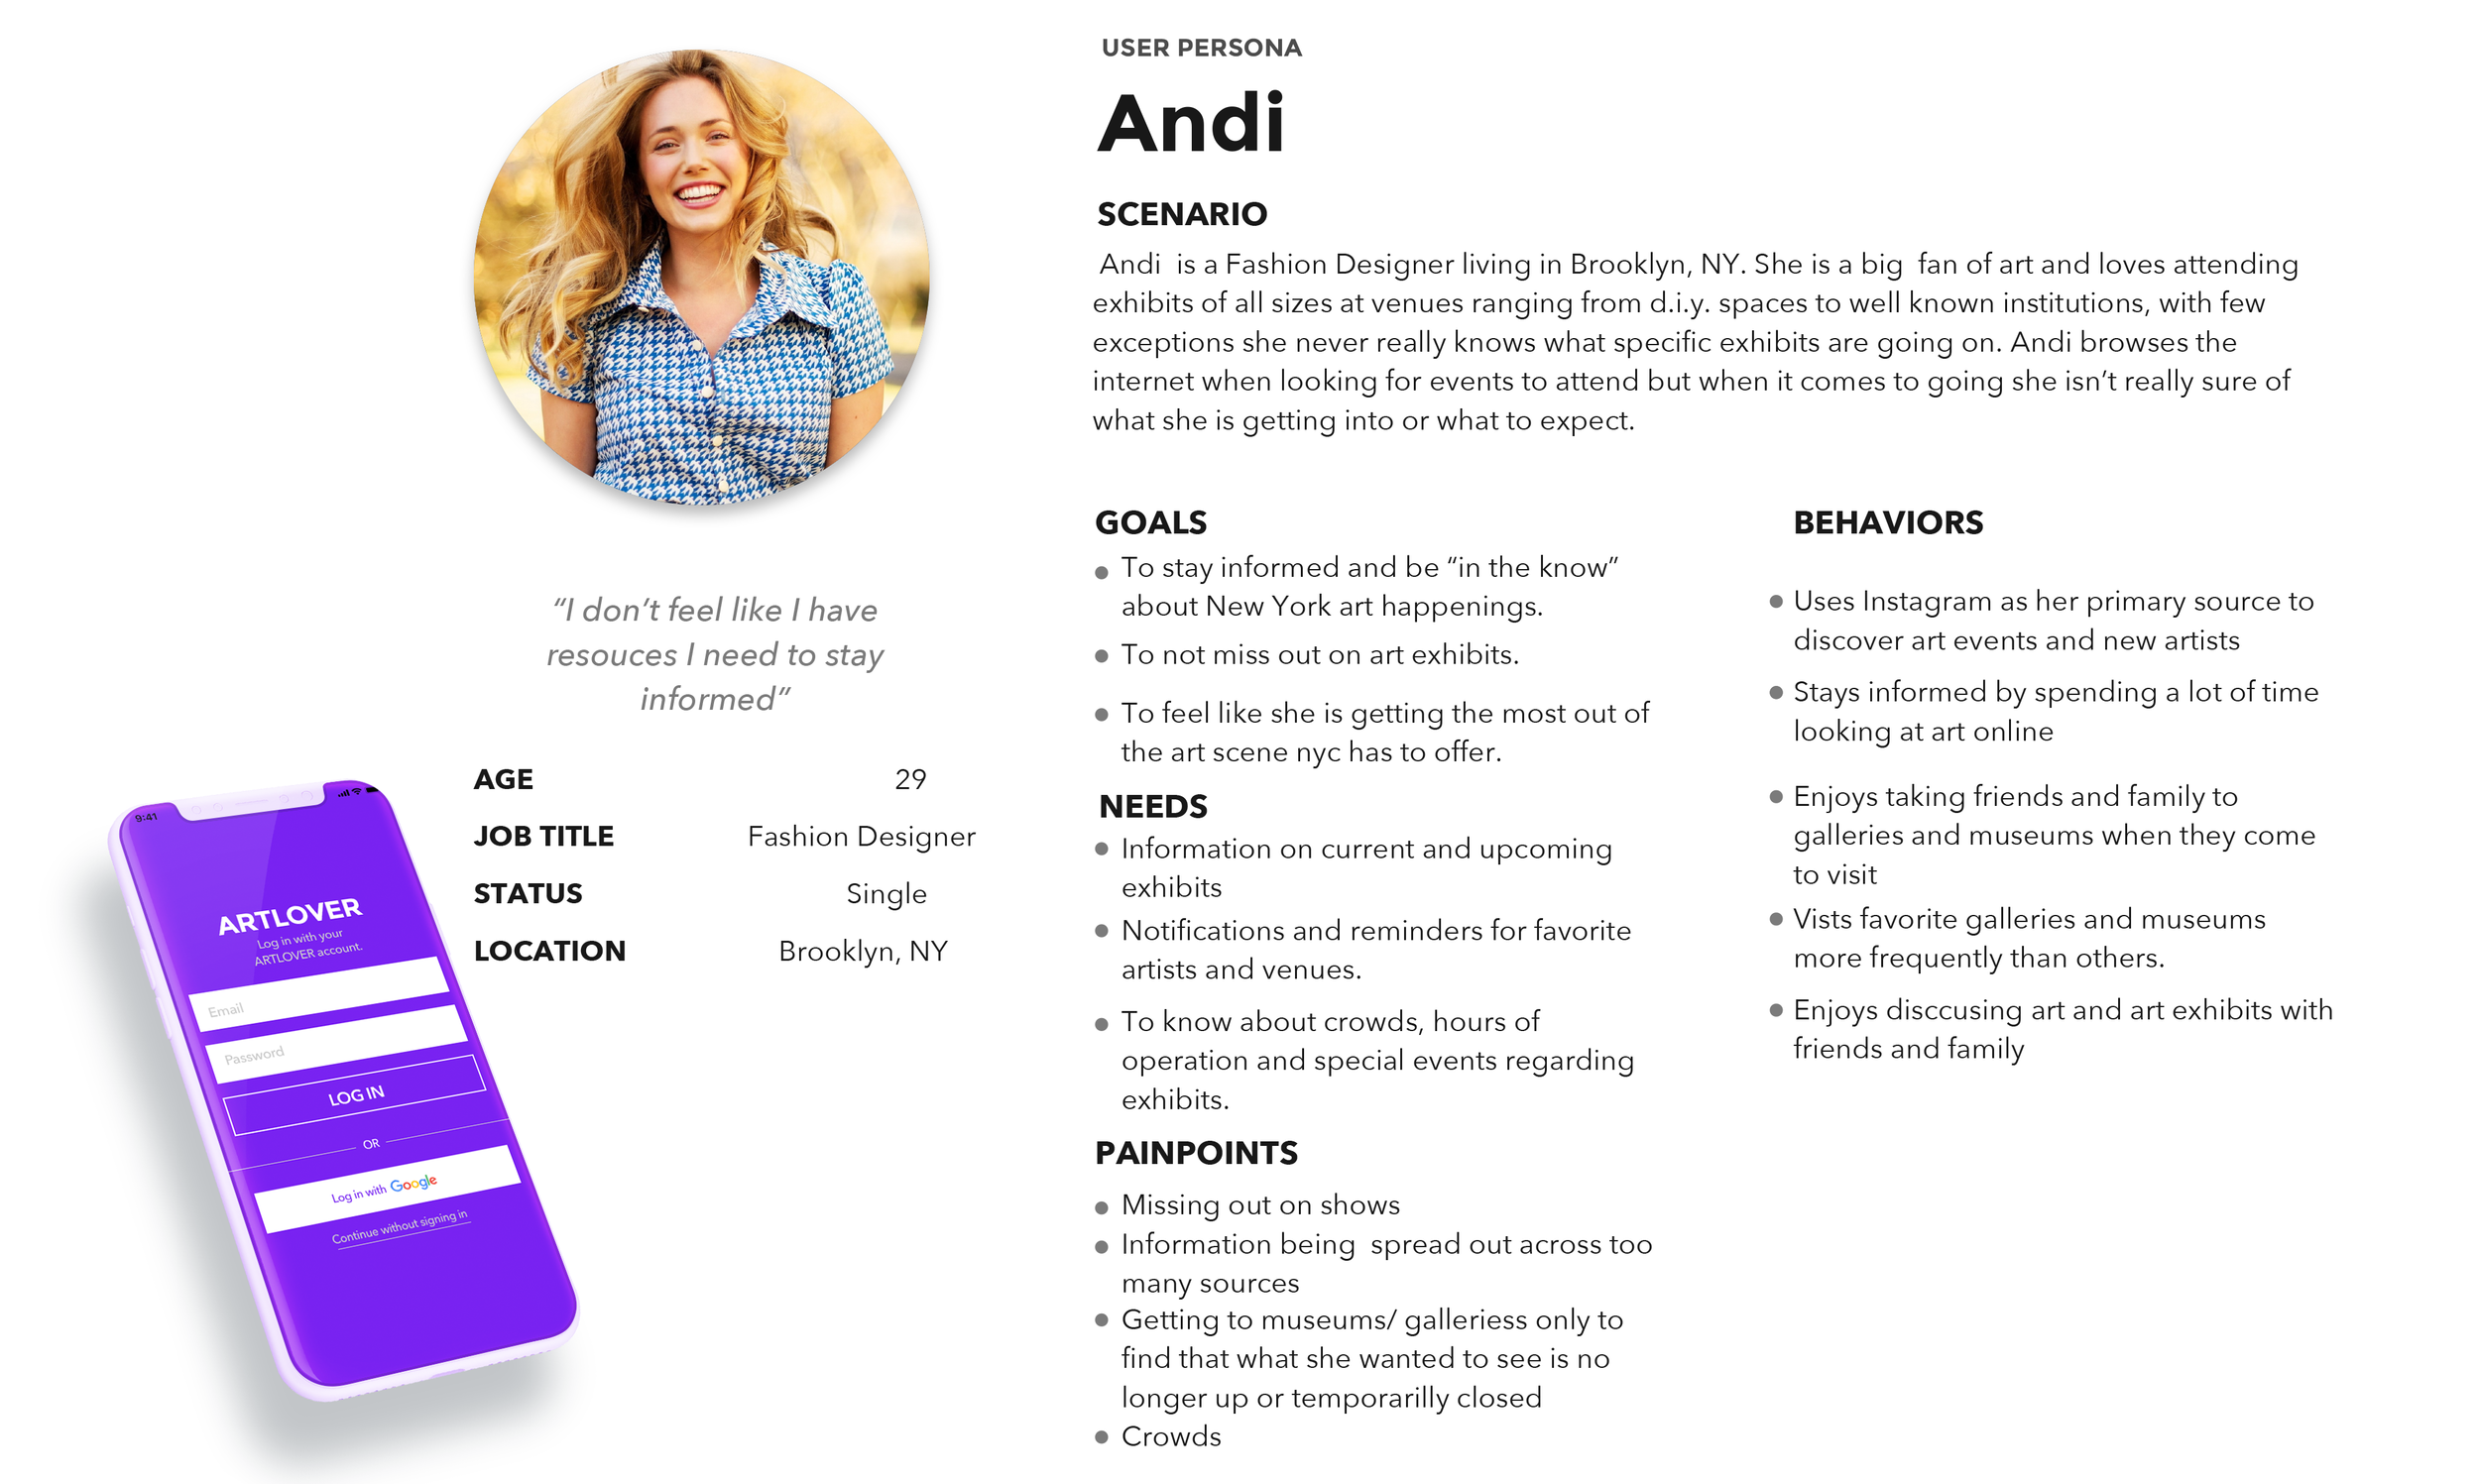
Andi’s Persona
We complied with our affinity mapping insights into a Persona to help us empathize with the user’s needs, goals and pain points.
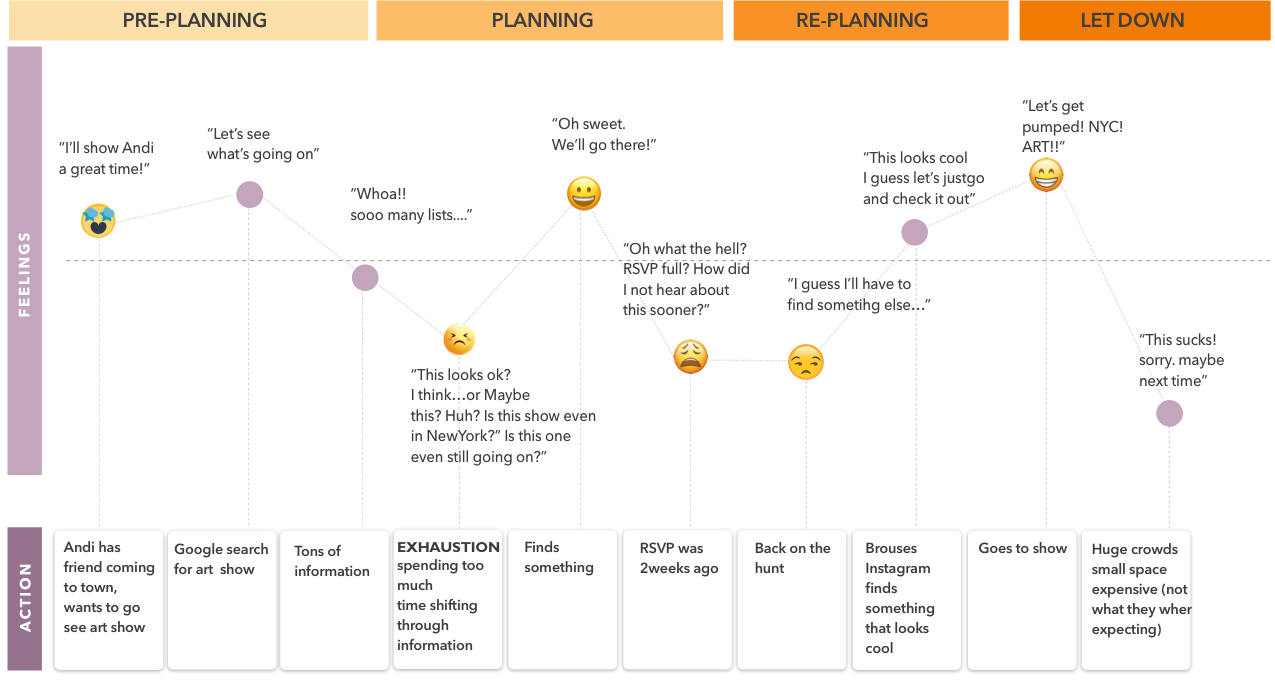
Andi’s Journey
We defined Andy’s Journey to understand where the touch point happened. This helped us understand how to improve the user’s flow when users are looking to see an art exhibit (in terms of planning). Also, this led us to have better empathy with users as well as to where caused real pain points.
05_Ideate
Design Studio
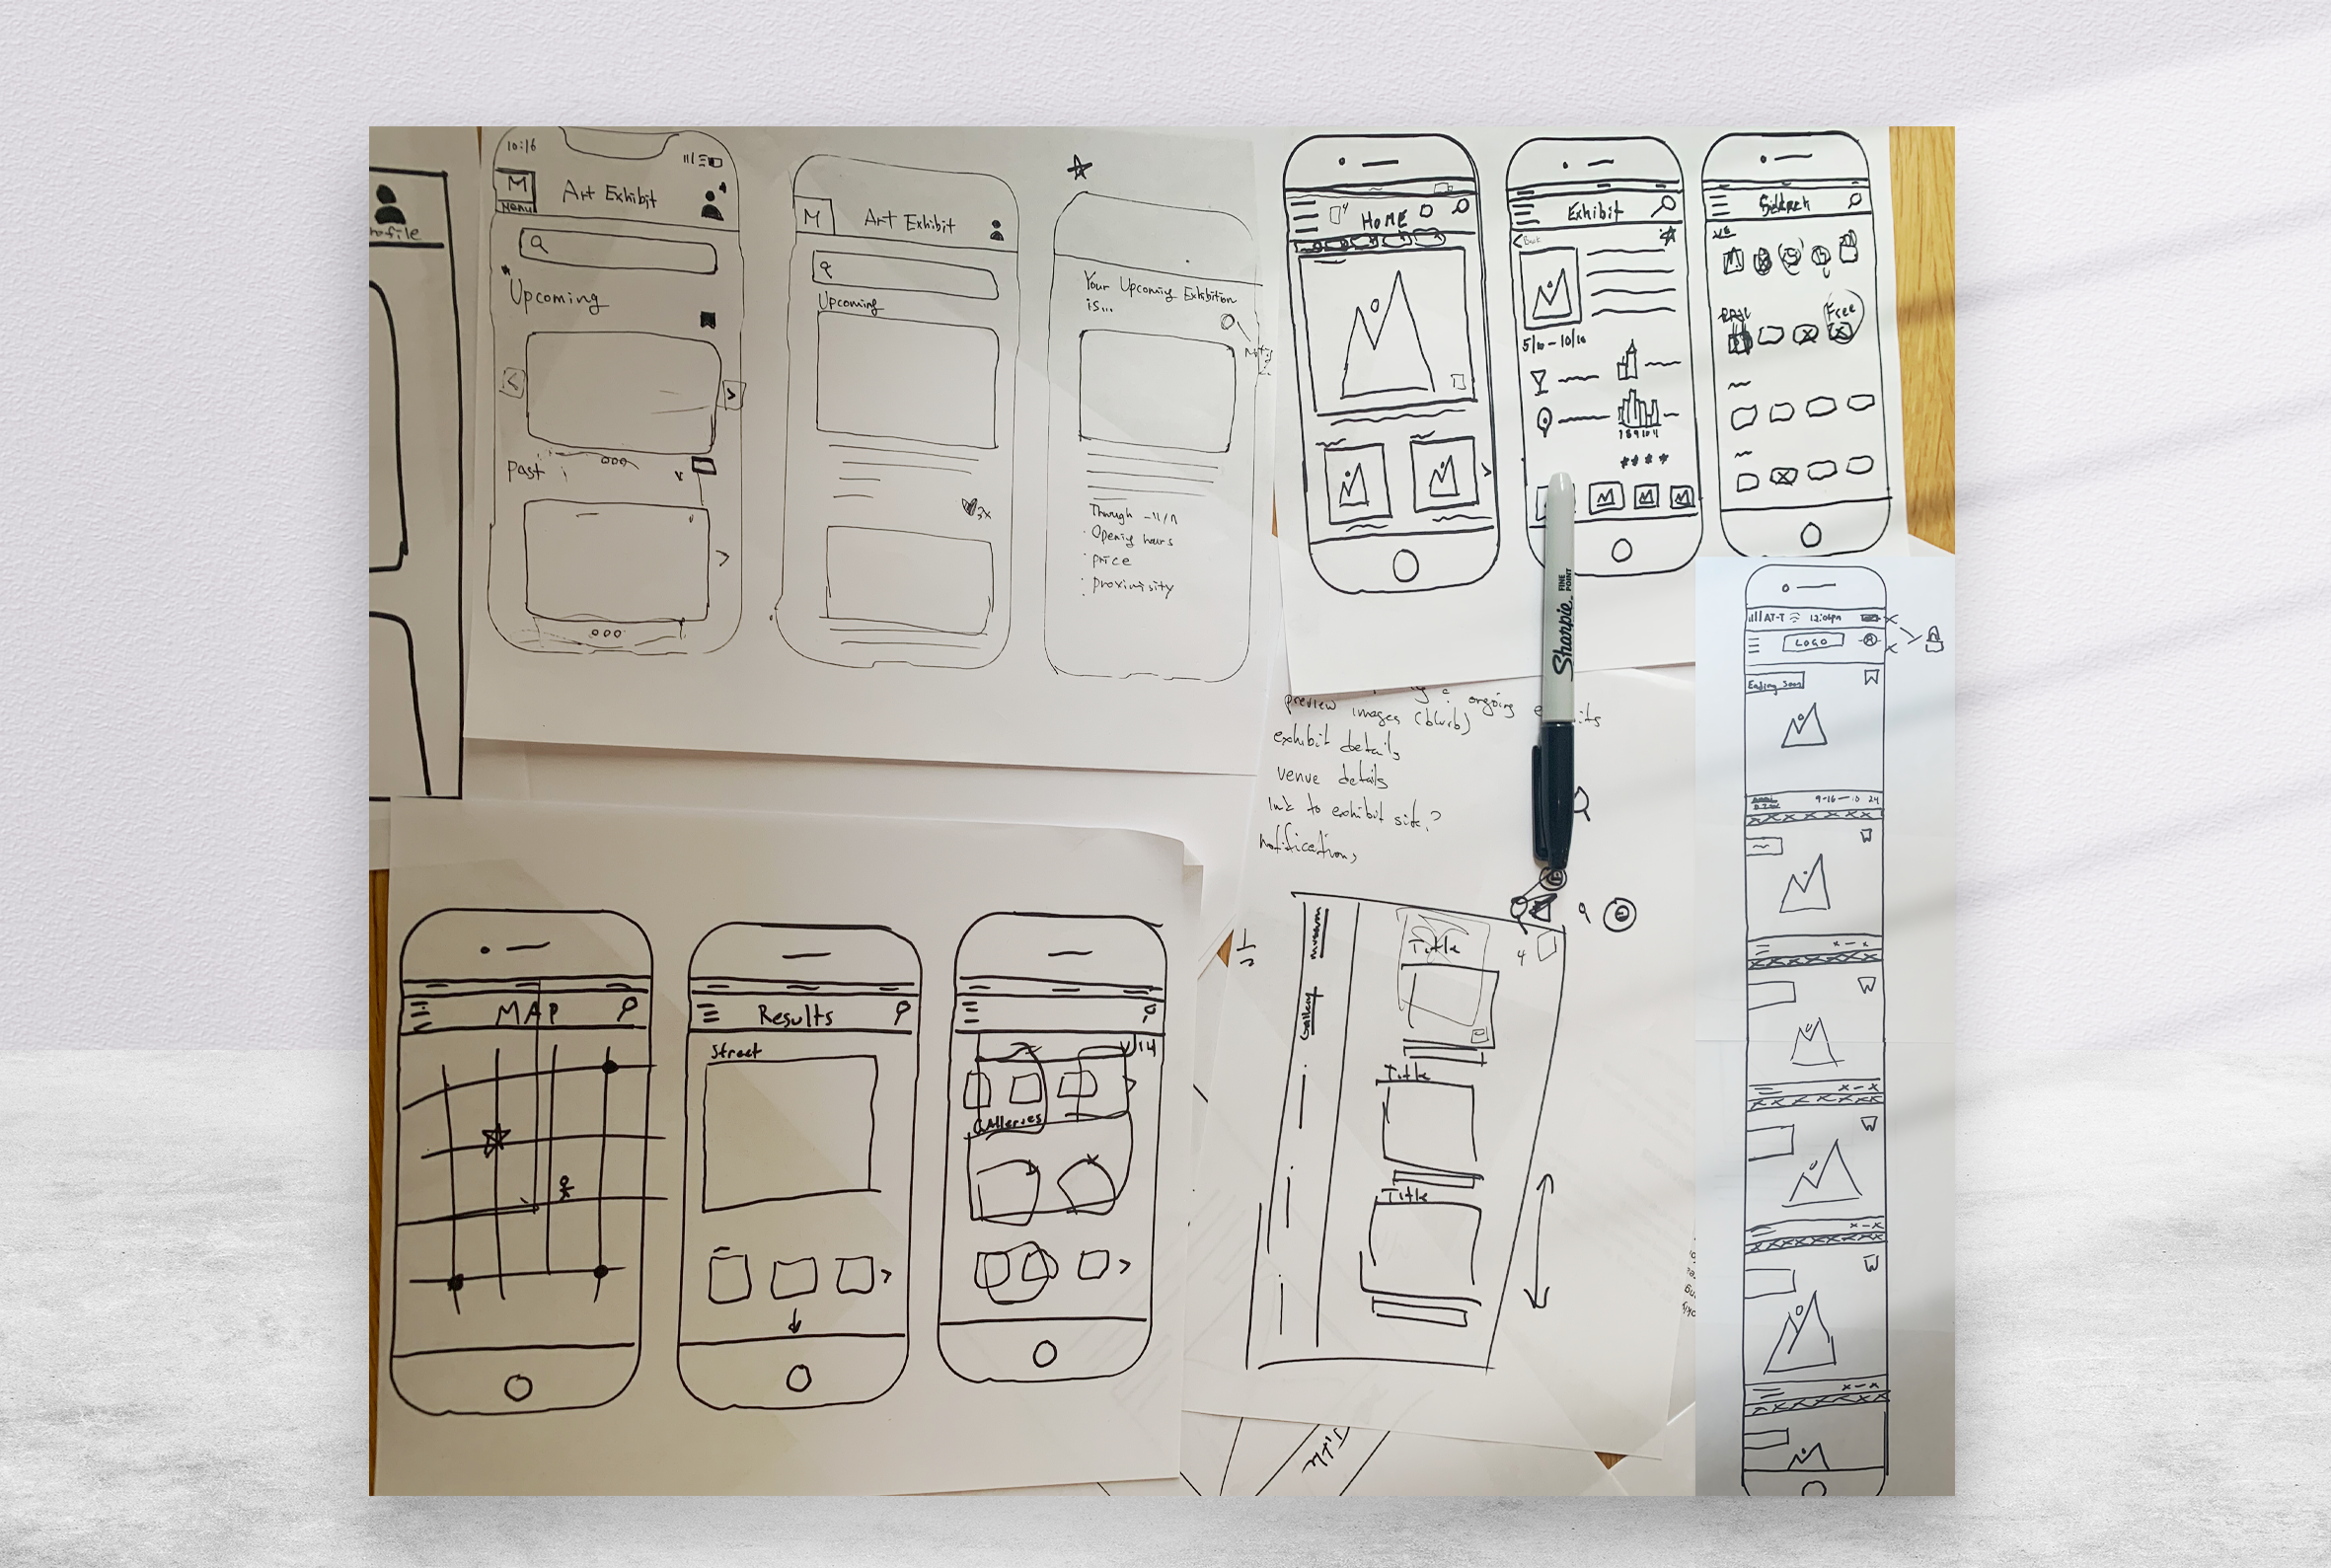
After we have consolidated insight from our users, we were finally ready to go to ideation, which is my favorite part of the design process. Our team gathered and utilized the Design Studio methodology which allows individuals to ideate rapidly with a pen and paper. We conducted three rounds of the Design Studio. The entire process took less than 45 minutes. Each individual drew and shared initial ideas in the first round. After receiving feedback, they were required to mimic at least one idea from another team member and create a better version. In the third round, we sketched and converged the designs into a single version as a group and then discussed them in order to make a consensus.
The outcomes of the Design Studio are illustrated below. By implementing this, all members contributed at least one idea to the design as well as we effectively and quickly applied a tons of information into the design with consensus.


Usability Test
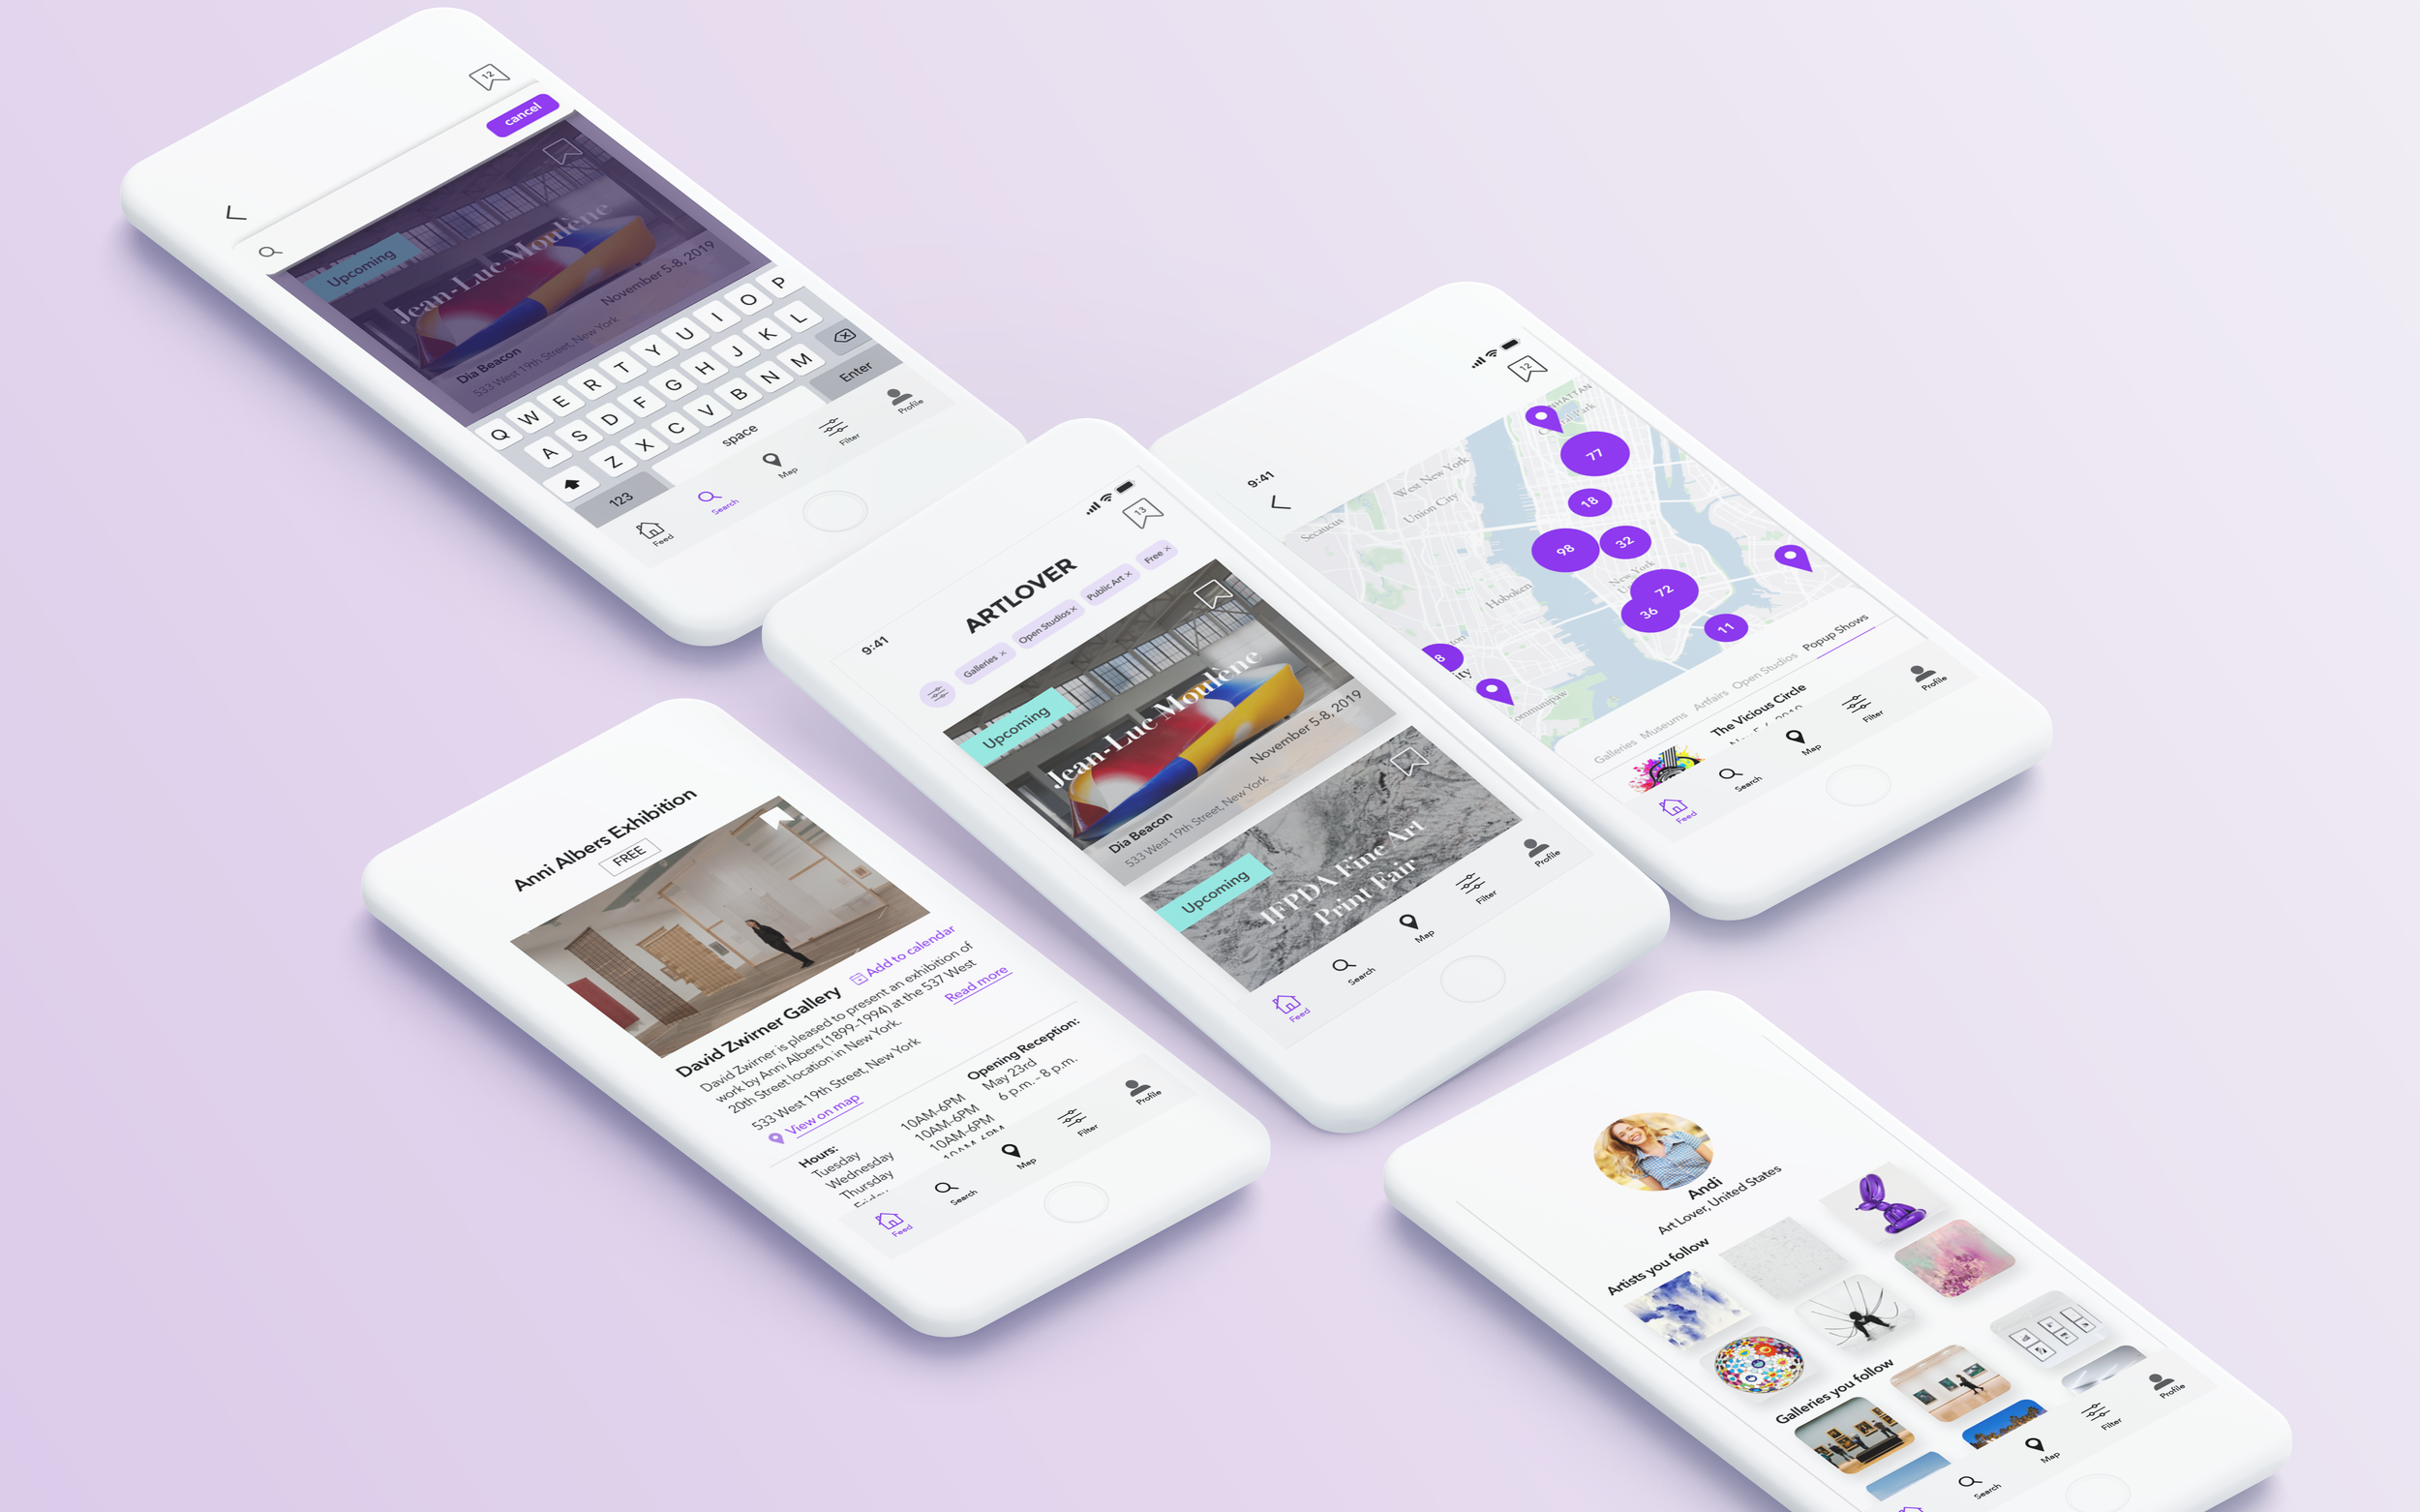
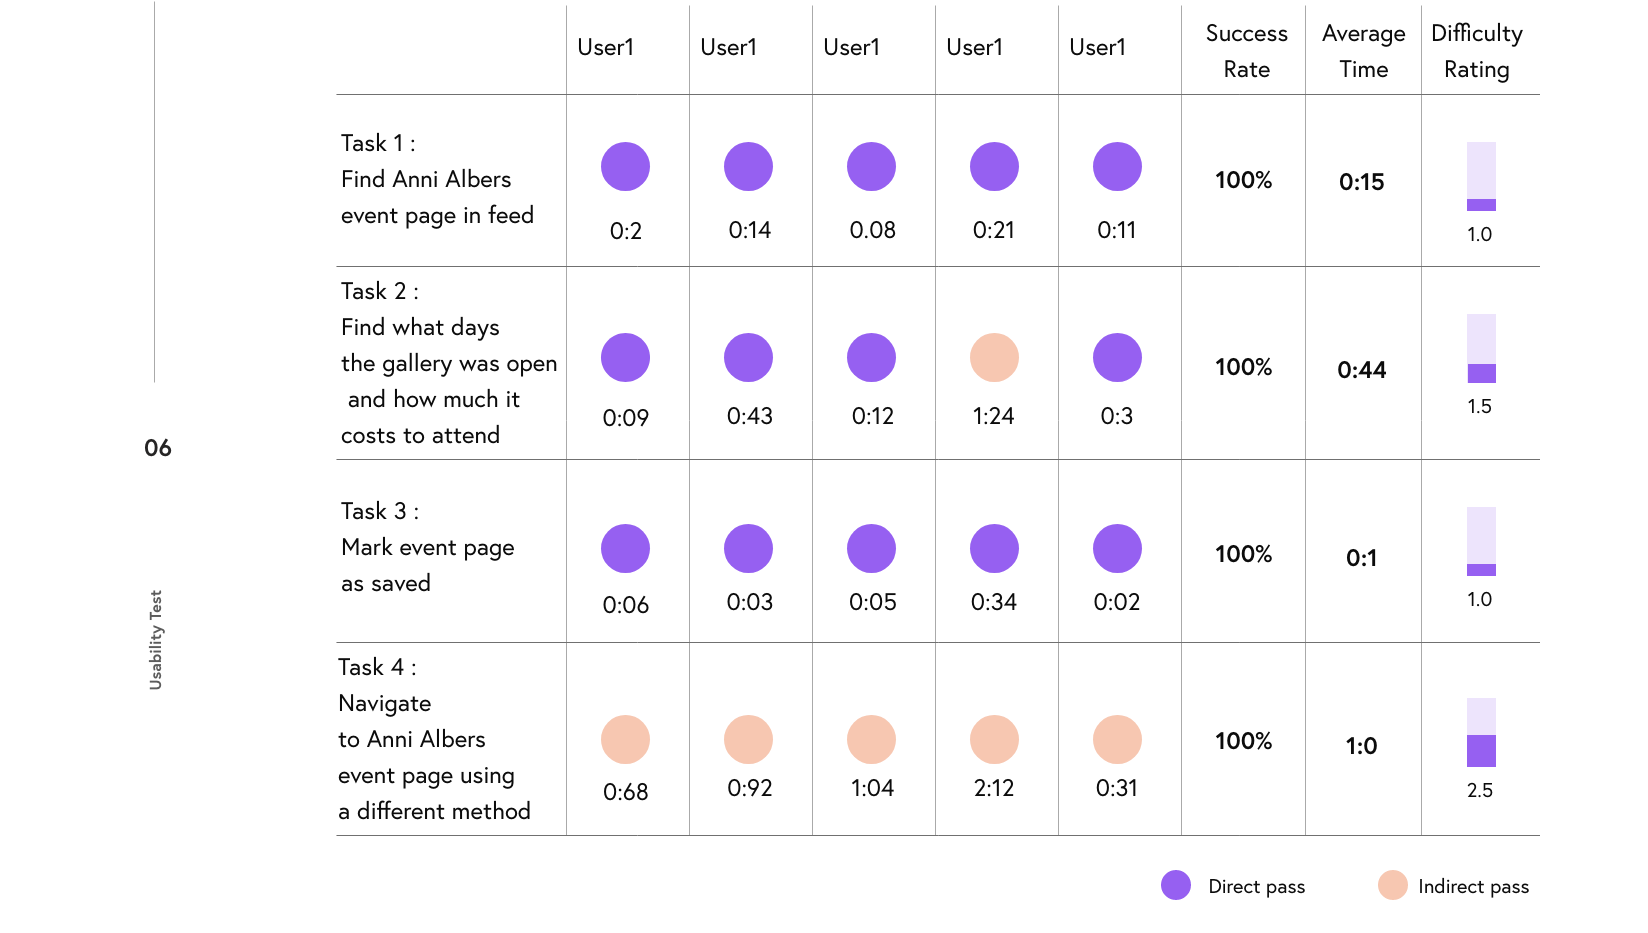
To see if our design functionally works, we tested our design through an Invision prototype. We made slight changes from our mid-fidelity version of testing. Other than that, we added color and photos to the app. We asked our users to complete four tasks below, and, we observed average time, success rate and difficulty rating showing below.
06_Deliver
Test Reflection
We were glad that users were thrilled at the idea of having a single source to find information on art in New York. Additionally, users appreciated the fact ArtLover could be used with and without signing up for an account. All users completed their tasks successfully. Average time spent on tasks remained the similar in comparison to the mid-fidelity testing. While users found the design intuitive and easy to use, they did offer valuable feedback for future iterations.
Next Steps
We’d like to apply user’s feedback by making the app more utilizable.
We will develop more of map feature as we found that 2nd users who doesn’t plan ahead, would like to enjoy art show when they instantly got free time and they would like to know if that’s available at the moment and where they are so, we’d like to provide/calculate average time seeing the show based on their interests(filter option will be more intensified) so that users can better access of art scene.
We learned that there are many areas of unknown street art or different types of art/events that are not showing on the web so, we wanted to do more research about and how can we design to reveal that on our app. We will also add features such as notifications, sharing information to friends and featured/emerging/unknown artists.